Turbulence does tricky things near walls. Boundary layers and laminar sublayers compact interesting flow patterns into a very small space. Small it may be, but experience proved we cannot ignore it. The boundary layer forms on the body, which is our object of interest, arguably the most critical region. Turbulence is most critical near the wall, and we need to consider near wall effects.
1.0 Introduction
Turbulence does tricky things near walls. Boundary layers and laminar sublayers compact interesting flow patterns into a very small space. Small it may be, but experience proved we cannot ignore it. The boundary layer forms on the body, which is our object of interest, arguably the most critical region. Turbulence is most critical near the wall, and we need to consider near wall effects.
2.0 Law of the Wall
Near wall effects remain synonymous with another phrase: “law of the wall”. The law of the wall showed that boundary layer of any wall divides into three regions, based on the distance from the wall. (Figure 2‑1) (Notice the logarithmic scale for the X-axis in the figure.)
Right next to the wall, we see a laminar sublayer. Notice how the data points curve upwards, matching an exponential pattern. In this layer, turbulent flow damps out and all flow returns to laminar.
Going farther out, we return to fully turbulent flow. You can identify this on the graph when the data points fit to a straight line (as plotted on a logarithmic X-axis). Moving farther out, the patterns break down. This indicates that we exited the boundary layer and transitioned into the main flow stream. The exact thickness of these different layers depends on the fluid involved and the flow velocities; that is why you see them represented as non-dimensional numbers in Figure 2‑1.
3.0 Y+ and Boundaries
Non-dimensional numbers play an important role in near wall effects, and the most important number is Y+. Y+ considers the CFD mesh. This number is the non-dimensional height of the first cell on the wall. Equation 1 shows the definition for Y+.
Technically, you can extend the definition to measure any non-dimensional distance away from the wall. But unless explicitly stated otherwise, assume that Y+ references the height of the first cell above the wall.
As part of the quality control, the CFD engineer plots out Y+ on the body (Figure 3‑1 shows an example). Y+ varies, due to changes in mesh size and local flow velocities. Notice that some parts of the body have higher Y+ than others. These variations matter because the CFD engineer seeks a target Y+ value, and practically every part of the body should achieve that target value.
4.0 Meshing Strategy for Y+ Targets
What value to target for Y+? It depends on the wall treatment method for your turbulence model. Remember the law of the wall; CFD developers generally approach the laminar sublayer with two possible solutions:
A wall damping function assumes you defined a very fine mesh that resolved the entire boundary layer, with cells going all the way down into the laminar sublayer. In this case, the damping function reduces turbulence model near the wall, based on the Y+ distance.
Alternatively, a wall function assumes the entire laminar sublayer was contained within the thickness of the first cell on the wall. Rather than damping out the turbulence model, it integrates the effect of the laminar sublayer and applies that effect within that first cell only. All the cells remain fully turbulent.
The meshing strategy for the CFD engineer depends on the selected wall function. The mesh height near the wall must be set to match the selected wall treatment. And we measure mesh height by Y+. Table 4‑1 shows recommended values for Y+ settings. The table shows the Y+ value for the typical break between laminar sublayer and turbulent boundary layer. But most CFD engineers prefer to include a safety margin and ensure their entire body remains meshed with the correct settings. The third column in the table shows recommended settings with those safety margins.
Y+ Range
Recommended Setting (with safety margin)
Wall damping function
12-30
2-5
Wall function
30+
40 – 80
Table 4‑1: Recommended Values for Y+ Ranges
5.0 Conclusion
The boundary layer may be small, but it features as the most critical part of turbulence. Near wall effects determine how turbulence interacts with the body, our object of interest. Accurate modeling of these small regions is critical. The CFD engineer needs to understand the law of the wall, the options for wall treatment of turbulence, and how that effects the meshing strategy. Small details make a big difference.
6.0 References
[1]
Q. Wang, C. Yan and T. Hui, “Mechanism Design for Aircraft Morphing Wing,” Research Gate, , Accessed: 2019, Jan, 01, April 2012.
[2]
V. R. Raj, “Quadratic Profile Used in QUICK Scheme,” Wikimedia Commons, 12 Nov 2012. . Available: https://commons.wikimedia.org/wiki/File:Quadratic_profile.jpg. .
[3]
Max Pixel, “Cumulus Storm Turbulence Thunderstorm Cloud Roller,” Max Pixel, 01 Jan 2019. . Available: https://www.maxpixel.net/Cumulus-Storm-Turbulence-Thunderstorm-Cloud-Roller-567678. .
[4]
S. Wasserman, “Choosing the Right Turbulence Model for Your CFD Simulation,” Engineering.com, 22 Nov 2016. . Available: https://www.engineering.com/DesignSoftware/DesignSoftwareArticles/ArticleID/13743/Choosing-the-Right-Turbulence-Model-for-Your-CFD-Simulation.aspx. .
[5]
S. Tao, F. Yuqing, L. Graeme and J. Kaixi, “CFD simulation of bubble recirculation regimes in an internal loop airlift reactor,” in 27th International Mineral Processing Congress, , Accessed: 2019, Jan, 01., January 2014.
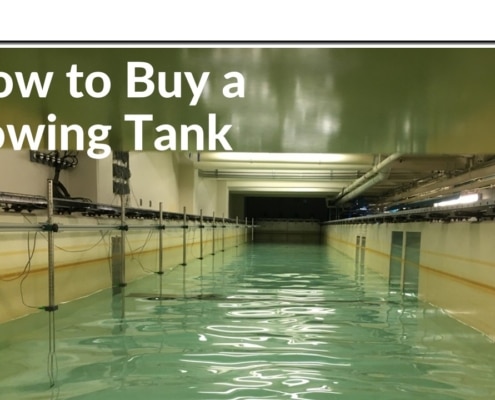
https://dmsonline.us/wp-content/uploads/2025/08/Clickbait.jpg7201280Nicholas Barczak/wp-content/uploads/2025/06/DMS-logo.svgNicholas Barczak2025-11-11 07:00:002026-04-03 10:11:28How to Buy a Towing Tank: Purchase and Design Guide
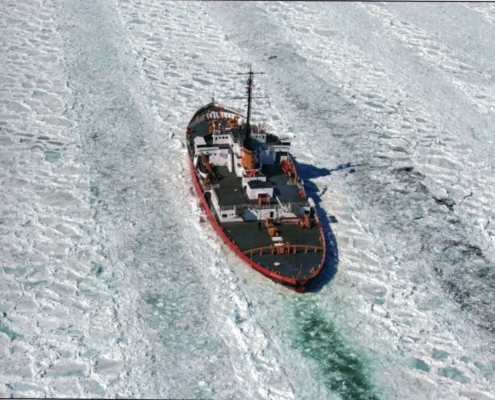
https://dmsonline.us/wp-content/uploads/2023/12/USCGC_Healy_WAGB-20_north_of_Alaska-scaled-1.jpg6331200Nate Riggins/wp-content/uploads/2025/06/DMS-logo.svgNate Riggins2024-05-14 09:00:002026-04-03 10:11:31Surviving the Arctic: Polar Class Icebreakers
https://dmsonline.us/wp-content/uploads/2022/03/Ever-Given-repaired.webp6671000Nate Riggins/wp-content/uploads/2025/06/DMS-logo.svgNate Riggins2022-03-21 08:00:002025-07-23 09:49:47Ever Given: What We Don’t Know
https://dmsonline.us/wp-content/uploads/2021/06/container-ship-2893480_1920.jpg9241386Nate Riggins/wp-content/uploads/2025/06/DMS-logo.svgNate Riggins2020-10-19 06:00:002026-04-03 10:11:35Stability Test Theory
We may request cookies to be set on your device. We use cookies to let us know when you visit our websites, how you interact with us, to enrich your user experience, and to customize your relationship with our website.
Click on the different category headings to find out more. You can also change some of your preferences. Note that blocking some types of cookies may impact your experience on our websites and the services we are able to offer.
Essential Website Cookies
These cookies are strictly necessary to provide you with services available through our website and to use some of its features.
Because these cookies are strictly necessary to deliver the website, refusing them will have impact how our site functions. You always can block or delete cookies by changing your browser settings and force blocking all cookies on this website. But this will always prompt you to accept/refuse cookies when revisiting our site.
We fully respect if you want to refuse cookies but to avoid asking you again and again kindly allow us to store a cookie for that. You are free to opt out any time or opt in for other cookies to get a better experience. If you refuse cookies we will remove all set cookies in our domain.
We provide you with a list of stored cookies on your computer in our domain so you can check what we stored. Due to security reasons we are not able to show or modify cookies from other domains. You can check these in your browser security settings.
Other external services
We also use different external services like Google Webfonts, Google Maps, and external Video providers. Since these providers may collect personal data like your IP address we allow you to block them here. Please be aware that this might heavily reduce the functionality and appearance of our site. Changes will take effect once you reload the page.